Understand audit and action logs
Review usage logs, database logs, log entry kinds, and Splunk audit display options for Red Hat Quay action logs.
Understanding usage logs
By default, Project Quay stores usage logs in its database and shows them in the web UI. You can query those logs in PostgreSQL and map action types by kind_id.
Usage logs appear at the organization and repository levels, and in the Superuser Admin Panel. Database logs capture a wide range of events in Project Quay, such as account plan changes, user actions, and general operations. Log entries include information such as the action performed (kind_id), the user who performed the action (account_id or performer_id), the timestamp (datetime), and other relevant data associated with the action (metadata_json).
Viewing database logs
To view repository usage logs stored in the Project Quay PostgreSQL database, you can query the logentry tables with the psql CLI tool.
-
You have administrative privileges.
-
You have installed the
psqlCLI tool.
-
Enter the following command to log in to your Project Quay PostgreSQL database:
$ psql -h <quay-server.example.com> -p 5432 -U <user_name> -d <database_name>Example outputpsql (16.1, server 13.7) Type "help" for help. -
Optional. Enter the following command to display the tables list of your PostgreSQL database:
quay=> \dtExample outputList of relations Schema | Name | Type | Owner --------+----------------------------+-------+---------- public | logentry | table | quayuser public | logentry2 | table | quayuser public | logentry3 | table | quayuser public | logentrykind | table | quayuser ... -
Enter the following command to return a list of
repository_idsthat are required to return log information:quay=> SELECT id, name FROM repository;Example outputid | name ----+--------------------- 3 | new_repository_name 6 | api-repo 7 | busybox ... -
Enter the following command to use the
logentry3relation to show log information about one of your repositories:SELECT * FROM logentry3 WHERE repository_id = <repository_id>;Example outputid | kind_id | account_id | performer_id | repository_id | datetime | ip | metadata_json 59 | 14 | 2 | 1 | 6 | 2024-05-13 15:51:01.897189 | 192.168.1.130 | {"repo": "api-repo", "namespace": "test-org"}In this example, the following information is returned:
{
  "log_data": {
    "id": 59
    "kind_id": "14",
    "account_id": "2",
    "performer_id": "1",
    "repository_id": "6",
    "ip": "192.168.1.100",
    "metadata_json": {"repo": "api-repo", "namespace": "test-org"}
    "datetime": "2024-05-13 15:51:01.897189"
  }
}
where:
id-
Specifies the unique identifier for the log entry.
kind_id-
Specifies the action that was performed. In this example,
14maps to creating a repository (create_repo). account_id-
Specifies the account that performed the action.
performer_id-
Specifies the performer of the action.
repository_id-
Specifies the repository that the action was performed on. In this example,
6correlates to theapi-reporepository from the previous step. ip-
Specifies the IP address where the action was performed.
metadata_json-
Specifies metadata information, including the name of the repository and its namespace.
datetime-
Specifies the time when the action was performed.
Log entry kind_ids
The kind_id value in a Project Quay usage log entry identifies the type of action that was recorded. You can use this table to map each kind_id to its action name and description.
| kind_id | Action | Description |
|---|---|---|
1 |
account_change_cc |
Change of credit card information. |
2 |
account_change_password |
Change of account password. |
3 |
account_change_plan |
Change of account plan. |
4 |
account_convert |
Account conversion. |
5 |
add_repo_accesstoken |
Adding an access token to a repository. |
6 |
add_repo_notification |
Adding a notification to a repository. |
7 |
add_repo_permission |
Adding permissions to a repository. |
8 |
add_repo_webhook |
Adding a webhook to a repository. |
9 |
build_dockerfile |
Building a Dockerfile. |
10 |
change_repo_permission |
Changing permissions of a repository. |
11 |
change_repo_visibility |
Changing the visibility of a repository. |
12 |
create_application |
Creating an application. |
13 |
create_prototype_permission |
Creating permissions for a prototype. |
14 |
create_repo |
Creating a repository. |
15 |
create_robot |
Creating a robot (service account or bot). |
16 |
create_tag |
Creating a tag. |
17 |
delete_application |
Deleting an application. |
18 |
delete_prototype_permission |
Deleting permissions for a prototype. |
19 |
delete_repo |
Deleting a repository. |
20 |
delete_repo_accesstoken |
Deleting an access token from a repository. |
21 |
delete_repo_notification |
Deleting a notification from a repository. |
22 |
delete_repo_permission |
Deleting permissions from a repository. |
23 |
delete_repo_trigger |
Deleting a repository trigger. |
24 |
delete_repo_webhook |
Deleting a webhook from a repository. |
25 |
delete_robot |
Deleting a robot. |
26 |
delete_tag |
Deleting a tag. |
27 |
manifest_label_add |
Adding a label to a manifest. |
28 |
manifest_label_delete |
Deleting a label from a manifest. |
29 |
modify_prototype_permission |
Modifying permissions for a prototype. |
30 |
move_tag |
Moving a tag. |
31 |
org_add_team_member |
Adding a member to a team. |
32 |
org_create_team |
Creating a team within an organization. |
33 |
org_delete_team |
Deleting a team within an organization. |
34 |
org_delete_team_member_invite |
Deleting a team member invitation. |
35 |
org_invite_team_member |
Inviting a member to a team in an organization. |
36 |
org_remove_team_member |
Removing a member from a team. |
37 |
org_set_team_description |
Setting the description of a team. |
38 |
org_set_team_role |
Setting the role of a team. |
39 |
org_team_member_invite_accepted |
Acceptance of a team member invitation. |
40 |
org_team_member_invite_declined |
Declining of a team member invitation. |
41 |
pull_repo |
Pull from a repository. |
42 |
push_repo |
Push to a repository. |
43 |
regenerate_robot_token |
Regenerating a robot token. |
44 |
repo_verb |
Generic repository action (specifics might be defined elsewhere). |
45 |
reset_application_client_secret |
Resetting the client secret of an application. |
46 |
revert_tag |
Reverting a tag. |
47 |
service_key_approve |
Approving a service key. |
48 |
service_key_create |
Creating a service key. |
49 |
service_key_delete |
Deleting a service key. |
50 |
service_key_extend |
Extending a service key. |
51 |
service_key_modify |
Modifying a service key. |
52 |
service_key_rotate |
Rotating a service key. |
53 |
setup_repo_trigger |
Setting up a repository trigger. |
54 |
set_repo_description |
Setting the description of a repository. |
55 |
take_ownership |
Taking ownership of a resource. |
56 |
update_application |
Updating an application. |
57 |
change_repo_trust |
Changing the trust level of a repository. |
58 |
reset_repo_notification |
Resetting repository notifications. |
59 |
change_tag_expiration |
Changing the expiration date of a tag. |
60 |
create_app_specific_token |
Creating an application-specific token. |
61 |
revoke_app_specific_token |
Revoking an application-specific token. |
62 |
toggle_repo_trigger |
Toggling a repository trigger on or off. |
63 |
repo_mirror_enabled |
Enabling repository mirroring. |
64 |
repo_mirror_disabled |
Disabling repository mirroring. |
65 |
repo_mirror_config_changed |
Changing the configuration of repository mirroring. |
66 |
repo_mirror_sync_started |
Starting a repository mirror sync. |
67 |
repo_mirror_sync_failed |
Repository mirror sync failed. |
68 |
repo_mirror_sync_success |
Repository mirror sync succeeded. |
69 |
repo_mirror_sync_now_requested |
Immediate repository mirror sync requested. |
70 |
repo_mirror_sync_tag_success |
Repository mirror tag sync succeeded. |
71 |
repo_mirror_sync_tag_failed |
Repository mirror tag sync failed. |
72 |
repo_mirror_sync_test_success |
Repository mirror sync test succeeded. |
73 |
repo_mirror_sync_test_failed |
Repository mirror sync test failed. |
74 |
repo_mirror_sync_test_started |
Repository mirror sync test started. |
75 |
change_repo_state |
Changing the state of a repository. |
76 |
create_proxy_cache_config |
Creating proxy cache configuration. |
77 |
delete_proxy_cache_config |
Deleting proxy cache configuration. |
78 |
start_build_trigger |
Starting a build trigger. |
79 |
cancel_build |
Canceling a build. |
80 |
org_create |
Creating an organization. |
81 |
org_delete |
Deleting an organization. |
82 |
org_change_email |
Changing organization email. |
83 |
org_change_invoicing |
Changing organization invoicing. |
84 |
org_change_tag_expiration |
Changing organization tag expiration. |
85 |
org_change_name |
Changing organization name. |
86 |
user_create |
Creating a user. |
87 |
user_delete |
Deleting a user. |
88 |
user_disable |
Disabling a user. |
89 |
user_enable |
Enabling a user. |
90 |
user_change_email |
Changing user email. |
91 |
user_change_password |
Changing user password. |
92 |
user_change_name |
Changing user name. |
93 |
user_change_invoicing |
Changing user invoicing. |
94 |
user_change_tag_expiration |
Changing user tag expiration. |
95 |
user_change_metadata |
Changing user metadata. |
96 |
user_generate_client_key |
Generating a client key for a user. |
97 |
login_success |
Successful login. |
98 |
logout_success |
Successful logout. |
99 |
permanently_delete_tag |
Permanently deleting a tag. |
100 |
autoprune_tag_delete |
Auto-pruning tag deletion. |
101 |
create_namespace_autoprune_policy |
Creating namespace auto-prune policy. |
102 |
update_namespace_autoprune_policy |
Updating namespace auto-prune policy. |
103 |
delete_namespace_autoprune_policy |
Deleting namespace auto-prune policy. |
104 |
login_failure |
Failed login attempt. |
Displaying Splunk audit logs in the Project Quay UI
To view Splunk audit logs in the Project Quay UI, you can configure Splunk or Splunk HEC credentials in your config.yaml file and restart the registry. Then open the Logs panel for an organization, repository, or superuser view.
-
You have created an
hec_token.NoteFor the HEC producer, two tokens are required:
hec_tokenfor writing logs andsearch_tokenfor reading logs in the UI. Thesearch_tokenis a bearer token (the same type you create when generating a Splunk bearer token). HEC tokens are ingest-only and cannot run searches. -
You have configured Project Quay to forward action logs to Splunk.
-
Update your
config.yamlfile:-
To display Splunk SDK audit logs on the Project Quay UI, use the following reference:
LOGS_MODEL: splunk
LOGS_MODEL_CONFIG:
  producer: splunk
  splunk_config:
    host: <splunk.example.com>
    port: 8089
    bearer_token: <your_bearer_token>
    url_scheme: https
    verify_ssl: false
    index_prefix: quay_logs
    search_timeout: 60
    max_results: 10000
    export_batch_size: 5000
where:
LOGS_MODEL_CONFIG.splunk_config.host-
Specifies the host name of your Splunk instance.
LOGS_MODEL_CONFIG.splunk_config.bearer_token-
Specifies the bearer token you generated for Splunk.
LOGS_MODEL_CONFIG.splunk_config.index_prefix-
Specifies the Splunk index prefix.
-
To display Splunk HEC logs on the Project Quay UI, include the generated
search_tokenandhec_token. For example:LOGS_MODEL: splunk LOGS_MODEL_CONFIG: producer: splunk_hec splunk_hec_config: host: <splunk.example.com> port: 8088 hec_token: <your_hec_token> search_token: <your_bearer_token> url_scheme: https verify_ssl: true ssl_ca_path: conf/stack/ca.pem index: quay_logs splunk_host: <quay-server.example.com> splunk_sourcetype: access_combined timeout: 10 search_host: <splunk.example.com> search_port: 8089 search_timeout: 60 max_results: 10000 export_batch_size: 5000where:
LOGS_MODEL_CONFIG.splunk_hec_config.host-
Specifies the host name of your Splunk instance (used for both the HEC endpoint and the search API).
LOGS_MODEL_CONFIG.splunk_hec_config.port-
Specifies the port number for the Splunk HEC endpoint.
LOGS_MODEL_CONFIG.splunk_hec_config.hec_token-
Specifies the HEC token you generated for Splunk.
LOGS_MODEL_CONFIG.splunk_hec_config.search_token-
Specifies the bearer token you generated for Splunk search. This field is optional.
LOGS_MODEL_CONFIG.splunk_hec_config.splunk_host-
Specifies the host name of your Project Quay instance.
-
-
Restart your Project Quay instance to apply the changes.
-
Push an example image to your Project Quay instance to generate an audit log by entering the following command. Note that you can push to an organization or a repository.
$ podman push <quay-server.example.com>/<organization_name>/busybox:test -
On the Project Quay UI, open the Logs view in one of these places:
-
Organizations → <organization_name> → Logs
-
Repositories → <organization_name> / <repository_name> → Logs
-
Superuser → Usage Logs
-
-
The
busybox:testSplunk audit is available.
Exporting logs by using the API
To export detailed Project Quay logs for a user, organization, or repository, you can call the export logs API endpoints and deliver the results to a callback URL or email address.
-
You have created an OAuth access token.
-
Use the
POST /api/v1/user/exportlogsendpoint to export logs for the current user:$ curl -X POST \ -H "Authorization: Bearer <bearer_token>" \ -H "Content-Type: application/json" \ -H "Accept: application/json" \ -d '{ "starttime": "<MM/DD/YYYY>", "endtime": "<MM/DD/YYYY>", "callback_email": "your.email@example.com" }' \ "http://<quay-server.example.com>/api/v1/user/exportlogs"Example output{"export_id": "6a0b9ea9-444c-4a19-9db8-113201c38cd4"} -
Use the
POST /api/v1/organization/{orgname}/exportlogsendpoint to export logs for an organization:$ curl -X POST \ -H "Authorization: Bearer <bearer_token>" \ -H "Content-Type: application/json" \ -H "Accept: application/json" \ -d '{ "starttime": "<MM/DD/YYYY>", "endtime": "<MM/DD/YYYY>", "callback_email": "org.logs@example.com" }' \ "http://<quay-server.example.com>/api/v1/organization/{orgname}/exportlogs" -
Use the
POST /api/v1/repository/{repository}/exportlogsendpoint to export logs for a repository:$ curl -X POST \ -H "Authorization: Bearer <bearer_token>" \ -H "Content-Type: application/json" \ -H "Accept: application/json" \ -d '{ "starttime": "2024-01-01", "endtime": "2024-06-18", "callback_url": "http://your-callback-url.example.com" }' \ "http://<quay-server.example.com>/api/v1/repository/{repository}/exportlogs"
View and export registry usage logs
View and export usage logs from the Red Hat Quay UI and API, including aggregated and detailed log views.
Viewing and exporting logs
Activity logs in Project Quay record repository and namespace events for operations and security review. You can view usage patterns and export logs for longer-term retention.
Usage logs might reveal the following information:
-
Resource Planning: Usage logs can provide data on the number of image pulls, pushes, and overall traffic to your registry.
-
User Activity: Logs can help you track user activity, showing which users are accessing and interacting with images in the registry. This can be useful for auditing, understanding user behavior, and managing access controls.
-
Usage Patterns: By studying usage patterns, you can gain insights into which images are popular, which versions are frequently used, and which images are rarely accessed. This information can help prioritize image maintenance and cleanup efforts.
-
Security Auditing: Usage logs enable you to track who is accessing images and when. This is crucial for security auditing, compliance, and investigating any unauthorized or suspicious activity.
-
Image Lifecycle Management: Logs can reveal which images are being pulled, pushed, and deleted. This information is essential for managing image lifecycles, including deprecating old images and ensuring that only authorized images are used.
-
Compliance and Regulatory Requirements: Many industries have compliance requirements that mandate tracking and auditing of access to sensitive resources. Usage logs can help you demonstrate compliance with such regulations.
-
Identifying Abnormal Behavior: Unusual or abnormal patterns in usage logs can indicate potential security breaches or malicious activity. Monitoring these logs can help you detect and respond to security incidents more effectively.
-
Trend Analysis: Over time, usage logs can provide trends and insights into how your registry is being used. This can help you make informed decisions about resource allocation, access controls, and image management strategies.
There are multiple ways of accessing log files:
-
Viewing logs through the web UI.
-
Exporting logs so that they can be saved externally.
-
Accessing log entries using the API.
To access logs, you must have administrative privileges for the selected repository or namespace.
|
Note
|
A maximum of 100 log results are available at a time via the API. To gather more results that that, you must use the log exporter feature described in this chapter. |
Viewing usage logs
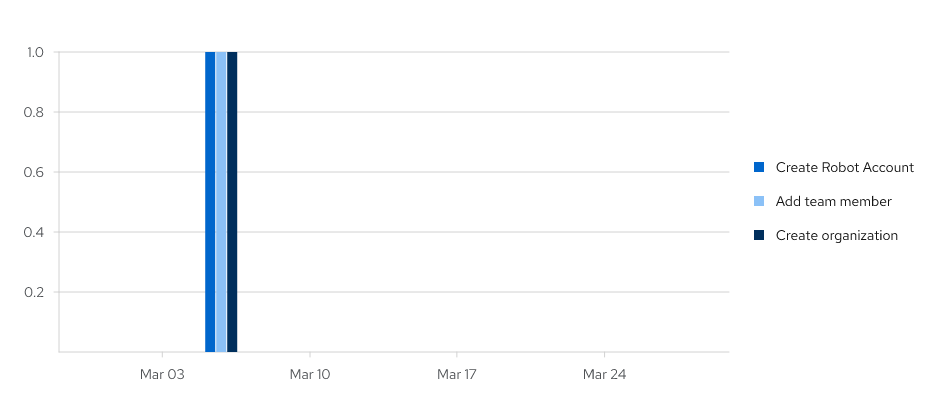
To review how your registry is being used, you can view usage logs for an organization, repository, or namespace in the Project Quay v2 UI. You can filter by date range and export the logs for later use.
-
Log in to your Project Quay registry.
-
Navigate to an Organization, repository, or namespace for which you are an administrator of.
-
Click Logs.
-
Optional. Set the date range for viewing log entries by adding dates to the From and To boxes.
-
Optional. Export the logs by clicking Export. You must enter an email address or a valid callback URL that uses the HTTP or HTTPS scheme. This process can take an hour depending on how many logs there are.
Viewing usage logs by using the API
To review registry activity, you can view usage logs by organization or repository through the Project Quay API. You can aggregate logs, list detailed entries, filter by user or date range, and page through results.
Viewing aggregated logs
To review grouped activity for a user, organization, or repository in Project Quay, you can retrieve aggregated logs through the API. You can filter results by performer and date range.
-
You have created an OAuth access token.
-
Use the
GET /api/v1/user/aggregatelogsAPI endpoint to return the aggregated (or grouped) logs for the current user:$ curl -X GET \ -H "Authorization: Bearer <bearer_token>" \ -H "Accept: application/json" \ "https://<quay-server.example.com>/api/v1/user/aggregatelogs"The following example shows aggregated log output:
{"aggregated": [{"kind": "create_tag", "count": 1, "datetime": "Tue, 18 Jun 2024 00:00:00 -0000"}, {"kind": "manifest_label_add", "count": 1, "datetime": "Tue, 18 Jun 2024 00:00:00 -0000"}, {"kind": "push_repo", "count": 2, "datetime": "Tue, 18 Jun 2024 00:00:00 -0000"}, {"kind": "revert_tag", "count": 1, "datetime": "Tue, 18 Jun 2024 00:00:00 -0000"}]}You can also pass in the
performerandstarttime/endtimequeries to obtain aggregated logs for a specific user between a specific time period. For example:$ curl -X GET \ -H "Authorization: Bearer <bearer_token>" \ -H "Accept: application/json" \ "<quay-server.example.com>/api/v1/user/aggregatelogs?performer=<username>&starttime=<MM/DD/YYYY>&endtime=<MM/DD/YYYY>" -
View aggregated logs by organization by using the
GET /api/v1/organization/{orgname}/aggregatelogsendpoint. For example:$ curl -X GET \ -H "Authorization: Bearer <bearer_token>" \ -H "Accept: application/json" \ "<quay-server.example.com>/api/v1/organization/{orgname}/aggregatelogs" -
View aggregated logs by repository by using the
GET /api/v1/repository/{repository}/aggregatelogsendpoint. The following example includes thestarttime/endtimefields:$ curl -X GET \ -H "Authorization: Bearer <bearer_token>" \ -H "Accept: application/json" \ "<quay-server.example.com>/api/v1/repository/<repository_name>/<namespace>/aggregatelogs?starttime=2024-01-01&endtime=2024-06-18""
Viewing detailed logs
To inspect individual registry events for a user, organization, or repository in Project Quay, you can retrieve detailed logs through the API. You can filter results by performer and date range.
-
Use the
GET /api/v1/user/logsAPI endpoint to return a list of log entries for a user. For example:$ curl -X GET -H "Authorization: Bearer <bearer_token>" -H "Accept: application/json" "<quay-server.example.com>/api/v1/user/logs"You can also pass in the
performerandstarttime/endtimequeries to obtain logs for a specific user between a specific time period. For example:$ curl -X GET -H "Authorization: Bearer <bearer_token>" -H "Accept: application/json" "http://quay-server.example.com/api/v1/user/logs?performer=quayuser&starttime=01/01/2024&endtime=06/18/2024"The following example shows detailed log output:
--- {"start_time": "Mon, 01 Jan 2024 00:00:00 -0000", "end_time": "Wed, 19 Jun 2024 00:00:00 -0000", "logs": [{"kind": "revert_tag", "metadata": {"username": "quayuser", "repo": "busybox", "tag": "test-two", "manifest_digest": "sha256:57583a1b9c0a7509d3417387b4f43acf80d08cdcf5266ac87987be3f8f919d5d"}, "ip": "192.168.1.131", "datetime": "Tue, 18 Jun 2024 18:59:13 -0000", "performer": {"kind": "user", "name": "quayuser", "is_robot": false, "avatar": {"name": "quayuser", "hash": "b28d563a6dc76b4431fc7b0524bbff6b810387dac86d9303874871839859c7cc", "color": "#17becf", "kind": "user"}}}, {"kind": "push_repo", "metadata": {"repo": "busybox", "namespace": "quayuser", "user-agent": "containers/5.30.1 (github.com/containers/image)", "tag": "test-two", "username": "quayuser", } --- -
Use the
GET /api/v1/organization/{orgname}/logsendpoint to return logs for a specified organization:$ curl -X GET \ -H "Authorization: Bearer <bearer_token>" \ -H "Accept: application/json" \ "http://<quay-server.example.com>/api/v1/organization/{orgname}/logs" -
Use the
GET /api/v1/repository/{repository}/logsendpoint to return logs for a specified repository:$ curl -X GET \ -H "Authorization: Bearer <bearer_token>" \ -H "Accept: application/json" \ "http://<quay-server.example.com>/api/v1/repository/{repository}/logs"
Exporting repository logs by using the UI
To export repository logs from Project Quay, you can use the Export Logs feature in the UI. You receive the exported data by email or callback URL, and it expires after a set time.
This feature has the following benefits and constraints:
-
You can choose a range of dates for the logs you want to gather from a repository.
-
You can request that the logs be sent to you by an email attachment or directed to a callback URL.
-
To export logs, you must be an administrator of the repository or namespace.
-
30 days worth of logs are retained for all users.
-
Export logs only gathers log data that was previously produced. It does not stream logging data.
-
When logs are gathered and made available to you, you should immediately copy that data if you want to save it. By default, the data expires after one hour.
Use the following procedure to export logs.
-
Select a repository for which you have administrator privileges.
-
Click the Logs tab.
-
Optional. If you want to specify specific dates, enter the range in the From and to boxes.
-
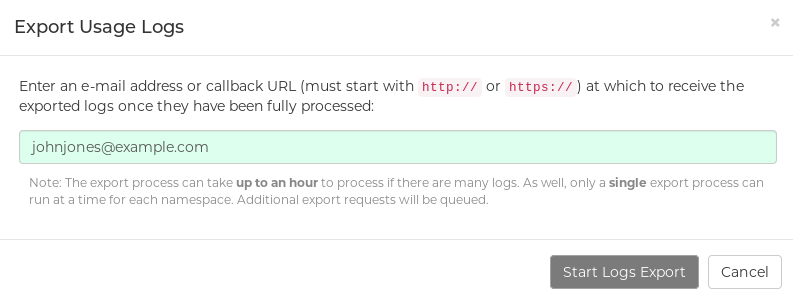
Click the Export Logs button. An Export Usage Logs pop-up appears, as shown
-
Enter an email address or callback URL to receive the exported log. For the callback URL, you can use a URL to a specified domain, for example, <webhook.site>.
-
Select Confirm to start the process for gather the selected log entries. Depending on the amount of logging data being gathered, this can take anywhere from a few minutes to several hours to complete.
-
When the log export is completed, the one of following two events happens:
-
An email is received, alerting you to the available of your requested exported log entries.
-
A successful status of your log export request from the webhook URL is returned. Additionally, a link to the exported data is made available for you to delete to download the logs.
-
Expose Prometheus metrics for Red Hat Quay
Expose Prometheus metrics from standalone and Operator Red Hat Quay deployments and configure Prometheus and DNS for scraping.
Prometheus and Grafana metrics under Project Quay
Project Quay exports a Prometheus- and Grafana-compatible metrics endpoint on each instance so that you can monitor and alert on registry activity.
Standalone Project Quay
To expose Prometheus metrics for a standalone Project Quay deployment, you can publish port 9091 when you start the Quay container.
-
When using
podman runto start theQuaycontainer, expose the metrics port9091:$ sudo podman run -d --rm -p 80:8080 -p 443:8443 -p 9091:9091\ --name=quay \ -v $QUAY/config:/conf/stack:Z \ -v $QUAY/storage:/datastorage:Z \ {productrepo}/{quayimage}:{productminv} -
Verify that the metrics are available:
$ curl quay.example.com:9091/metrics
Project Quay Operator
To access Prometheus metrics for an Operator-managed Project Quay deployment, you can use the cluster IP of the quay-metrics service.
-
Determine the cluster IP for the
quay-metricsservice:$ oc get services -n quay-enterprise NAME TYPE CLUSTER-IP EXTERNAL-IP PORT(S) AGE example-registry-clair-app ClusterIP 172.30.61.161 <none> 80/TCP,8089/TCP 18h example-registry-clair-postgres ClusterIP 172.30.122.136 <none> 5432/TCP 18h example-registry-quay-app ClusterIP 172.30.72.79 <none> 443/TCP,80/TCP,8081/TCP,55443/TCP 18h example-registry-quay-config-editor ClusterIP 172.30.185.61 <none> 80/TCP 18h example-registry-quay-database ClusterIP 172.30.114.192 <none> 5432/TCP 18h example-registry-quay-metrics ClusterIP 172.30.37.76 <none> 9091/TCP 18h example-registry-quay-redis ClusterIP 172.30.157.248 <none> 6379/TCP 18h -
Connect to your cluster and access the metrics using the cluster IP and port for the
quay-metricsservice:$ oc debug node/master-0 sh-4.4# curl 172.30.37.76:9091/metrics # HELP go_gc_duration_seconds A summary of the pause duration of garbage collection cycles. # TYPE go_gc_duration_seconds summary go_gc_duration_seconds{quantile="0"} 4.0447e-05 go_gc_duration_seconds{quantile="0.25"} 6.2203e-05 ...
Setting up Prometheus to consume metrics
To allow Prometheus to scrape metrics from every Project Quay instance in a cluster, you can publish the instances under a single DNS name that Prometheus can resolve.
DNS configuration under Kubernetes
To provide a DNS entry for Prometheus on Kubernetes, you can configure a simple Kubernetes service that resolves to your Project Quay instances.
DNS configuration for a manual cluster
To manage a Prometheus DNS record outside Kubernetes, you can use SkyDNS with an etcd cluster to track Project Quay instance addresses.
SkyDNS can run on an etcd cluster. Entries for each Project Quay instance in the cluster can be added and removed in the etcd store. SkyDNS regularly reads them from there and updates the list of Project Quay instances in the DNS record accordingly.
Understand Red Hat Quay Prometheus metrics
Review Prometheus metrics for registry queues, garbage collection, push and pull activity, and authentication.
General registry statistics
Use these general registry statistics metrics to track how large a Project Quay deployment has grown, including users, robots, organizations, repositories, and unscanned images.
| Metric name | Description |
|---|---|
quay_user_rows |
Number of users in the database |
quay_robot_rows |
Number of robot accounts in the database |
quay_org_rows |
Number of organizations in the database |
quay_repository_rows |
Number of repositories in the database |
quay_security_scanning_unscanned_images_remaining_total |
Number of images that are not scanned by the latest security scanner |
# HELP quay_user_rows number of users in the database
# TYPE quay_user_rows gauge
quay_user_rows{host="example-registry-quay-app-6df87f7b66-9tfn6",instance="",job="quay",pid="65",process_name="globalpromstats.py"} 3

# HELP quay_robot_rows number of robot accounts in the database
# TYPE quay_robot_rows gauge
quay_robot_rows{host="example-registry-quay-app-6df87f7b66-9tfn6",instance="",job="quay",pid="65",process_name="globalpromstats.py"} 2

# HELP quay_org_rows number of organizations in the database
# TYPE quay_org_rows gauge
quay_org_rows{host="example-registry-quay-app-6df87f7b66-9tfn6",instance="",job="quay",pid="65",process_name="globalpromstats.py"} 2

# HELP quay_repository_rows number of repositories in the database
# TYPE quay_repository_rows gauge
quay_repository_rows{host="example-registry-quay-app-6df87f7b66-9tfn6",instance="",job="quay",pid="65",process_name="globalpromstats.py"} 4

# HELP quay_security_scanning_unscanned_images_remaining number of images that are not scanned by the latest security scanner
# TYPE quay_security_scanning_unscanned_images_remaining gauge
quay_security_scanning_unscanned_images_remaining{host="example-registry-quay-app-6df87f7b66-9tfn6",instance="",job="quay",pid="208",process_name="secscan:application"} 5Use these queue items metrics to monitor the work queues that Project Quay uses for exports, garbage collection, notifications, builds, and storage replication.
| Metric name | Description |
|---|---|
quay_queue_items_available |
Number of items in a specific queue |
quay_queue_items_locked |
Number of items that are running |
quay_queue_items_available_unlocked |
Number of items that are waiting to be processed |
Metric labels:
queue_name-
The name of the queue. One of:
exportactionlogs-
Queued requests to export action logs. These logs are then processed and put in storage. A link is then sent to the requester by email.
namespacegc-
Queued namespaces to be garbage collected.
notification-
Queue for repository notifications to be sent out.
repositorygc-
Queued repositories to be garbage collected.
secscanv4-
Notification queue specific for Clair V4.
dockerfilebuild-
Queue for Project Quay container image builds.
imagestoragereplication-
Queued blob to be replicated across multiple storages.
chunk_cleanup-
Queued blob segments that need to be deleted. This is only used by some storage implementations, for example, Swift.
For example, the queue labeled repositorygc contains the repositories marked for deletion by the repository garbage collection worker. For metrics with a queue_name label of repositorygc:
-
quay_queue_items_lockedis the number of repositories currently being deleted. -
quay_queue_items_available_unlockedis the number of repositories waiting to get processed by the worker.
# HELP quay_queue_items_available number of queue items that have not expired
# TYPE quay_queue_items_available gauge
quay_queue_items_available{host="example-registry-quay-app-6df87f7b66-9tfn6",instance="",job="quay",pid="63",process_name="exportactionlogsworker.py",queue_name="exportactionlogs"} 0
...

# HELP quay_queue_items_available_unlocked number of queue items that have not expired and are not locked
# TYPE quay_queue_items_available_unlocked gauge
quay_queue_items_available_unlocked{host="example-registry-quay-app-6df87f7b66-9tfn6",instance="",job="quay",pid="63",process_name="exportactionlogsworker.py",queue_name="exportactionlogs"} 0
...

# HELP quay_queue_items_locked number of queue items that have been acquired
# TYPE quay_queue_items_locked gauge
quay_queue_items_locked{host="example-registry-quay-app-6df87f7b66-9tfn6",instance="",job="quay",pid="63",process_name="exportactionlogsworker.py",queue_name="exportactionlogs"} 0Use these garbage collection metrics to track how often garbage collection workers run and how many namespaces, repositories, and blobs they remove.
| Metric name | Description |
|---|---|
quay_gc_iterations_total |
Number of iterations by the GCWorker |
quay_gc_namespaces_purged_total |
Number of namespaces purged by the NamespaceGCWorker |
quay_gc_repos_purged_total |
Number of repositories purged by the RepositoryGCWorker or NamespaceGCWorker |
quay_gc_storage_blobs_deleted_total |
Number of storage blobs deleted |
# TYPE quay_gc_iterations_created gauge
quay_gc_iterations_created{host="example-registry-quay-app-6df87f7b66-9tfn6",instance="",job="quay",pid="208",process_name="secscan:application"} 1.6317823190189714e+09
...

# HELP quay_gc_iterations_total number of iterations by the GCWorker
# TYPE quay_gc_iterations_total counter
quay_gc_iterations_total{host="example-registry-quay-app-6df87f7b66-9tfn6",instance="",job="quay",pid="208",process_name="secscan:application"} 0
...

# TYPE quay_gc_namespaces_purged_created gauge
quay_gc_namespaces_purged_created{host="example-registry-quay-app-6df87f7b66-9tfn6",instance="",job="quay",pid="208",process_name="secscan:application"} 1.6317823190189433e+09
...

# HELP quay_gc_namespaces_purged_total number of namespaces purged by the NamespaceGCWorker
# TYPE quay_gc_namespaces_purged_total counter
quay_gc_namespaces_purged_total{host="example-registry-quay-app-6df87f7b66-9tfn6",instance="",job="quay",pid="208",process_name="secscan:application"} 0
....

# TYPE quay_gc_repos_purged_created gauge
quay_gc_repos_purged_created{host="example-registry-quay-app-6df87f7b66-9tfn6",instance="",job="quay",pid="208",process_name="secscan:application"} 1.631782319018925e+09
...

# HELP quay_gc_repos_purged_total number of repositories purged by the RepositoryGCWorker or NamespaceGCWorker
# TYPE quay_gc_repos_purged_total counter
quay_gc_repos_purged_total{host="example-registry-quay-app-6df87f7b66-9tfn6",instance="",job="quay",pid="208",process_name="secscan:application"} 0
...

# TYPE quay_gc_storage_blobs_deleted_created gauge
quay_gc_storage_blobs_deleted_created{host="example-registry-quay-app-6df87f7b66-9tfn6",instance="",job="quay",pid="208",process_name="secscan:application"} 1.6317823190189059e+09
...

# HELP quay_gc_storage_blobs_deleted_total number of storage blobs deleted
# TYPE quay_gc_storage_blobs_deleted_total counter
quay_gc_storage_blobs_deleted_total{host="example-registry-quay-app-6df87f7b66-9tfn6",instance="",job="quay",pid="208",process_name="secscan:application"} 0
...Use these multipart upload metrics to monitor blob uploads to object storage and to help identify failures when Project Quay cannot complete an upload.
The multipart uploads metrics show the number of blob uploads to storage (S3, Rados, GoogleCloudStorage, RHOCS).
| Metric name | Description |
|---|---|
quay_multipart_uploads_started_total |
Number of multipart uploads to Project Quay storage that started |
quay_multipart_uploads_completed_total |
Number of multipart uploads to Project Quay storage that completed |
# TYPE quay_multipart_uploads_completed_created gauge
quay_multipart_uploads_completed_created{host="example-registry-quay-app-6df87f7b66-9tfn6",instance="",job="quay",pid="208",process_name="secscan:application"} 1.6317823308284895e+09
...

# HELP quay_multipart_uploads_completed_total number of multipart uploads to Quay storage that completed
# TYPE quay_multipart_uploads_completed_total counter
quay_multipart_uploads_completed_total{host="example-registry-quay-app-6df87f7b66-9tfn6",instance="",job="quay",pid="208",process_name="secscan:application"} 0

# TYPE quay_multipart_uploads_started_created gauge
quay_multipart_uploads_started_created{host="example-registry-quay-app-6df87f7b66-9tfn6",instance="",job="quay",pid="208",process_name="secscan:application"} 1.6317823308284352e+09
...

# HELP quay_multipart_uploads_started_total number of multipart uploads to Quay storage that started
# TYPE quay_multipart_uploads_started_total counter
quay_multipart_uploads_started_total{host="example-registry-quay-app-6df87f7b66-9tfn6",instance="",job="quay",pid="208",process_name="secscan:application"} 0
...Use these image push and pull metrics to track how many images and bytes clients upload to or download from the Project Quay registry.
| Metric name | Description |
|---|---|
quay_registry_image_pulls_total |
The number of images downloaded from the registry. |
Metric labels:
protocol-
The registry protocol used (should always be
v2). ref-
Reference used to pull - tag, manifest.
status-
HTTP return code of the request.
| Metric name | Description |
|---|---|
quay_registry_image_pulled_estimated_bytes_total |
The number of bytes downloaded from the registry. |
Metric labels:
protocol-
The registry protocol used (should always be
v2).
| Metric name | Description |
|---|---|
quay_registry_image_pushes_total |
The number of images uploaded to the registry. |
Metric labels:
protocol-
The registry protocol used (should always be
v2). pstatus-
HTTP return code of the request.
pmedia_type-
The uploaded manifest type.
| Metric name | Description |
|---|---|
quay_registry_image_pushed_bytes_total |
The number of bytes uploaded to the registry. |
# HELP quay_registry_image_pushed_bytes_total number of bytes pushed to the registry
# TYPE quay_registry_image_pushed_bytes_total counter
quay_registry_image_pushed_bytes_total{host="example-registry-quay-app-6df87f7b66-9tfn6",instance="",job="quay",pid="221",process_name="registry:application"} 0
...Use these authentication metrics to count registry and API authentication requests by type and by whether each request succeeded or failed.
| Metric name | Description |
|---|---|
quay_authentication_attempts_total |
Number of authentication attempts across the registry and API |
Metric labels:
auth_kind-
The type of authentication used, including:
-
basic -
oauth -
credentials
-
success-
trueorfalse.
# TYPE quay_authentication_attempts_created gauge
quay_authentication_attempts_created{auth_kind="basic",host="example-registry-quay-app-6df87f7b66-9tfn6",instance="",job="quay",pid="221",process_name="registry:application",success="True"} 1.6317843039374158e+09
...

# HELP quay_authentication_attempts_total number of authentication attempts across the registry and API
# TYPE quay_authentication_attempts_total counter
quay_authentication_attempts_total{auth_kind="basic",host="example-registry-quay-app-6df87f7b66-9tfn6",instance="",job="quay",pid="221",process_name="registry:application",success="True"} 2
...
Monitor the registry from the OpenShift console
Monitor Red Hat Quay health and alerts from the OpenShift web console.
Console monitoring and alerting
Project Quay provides monitoring and alerting features in the OpenShift Container Platform console for instances deployed by the Operator. You can use Grafana dashboards, individual metrics, and alerts to monitor registry performance and receive notifications when Quay pods restart frequently.
|
Note
|
To enable the monitoring features, you must select All namespaces on the cluster as the installation mode when installing the Project Quay Operator. |
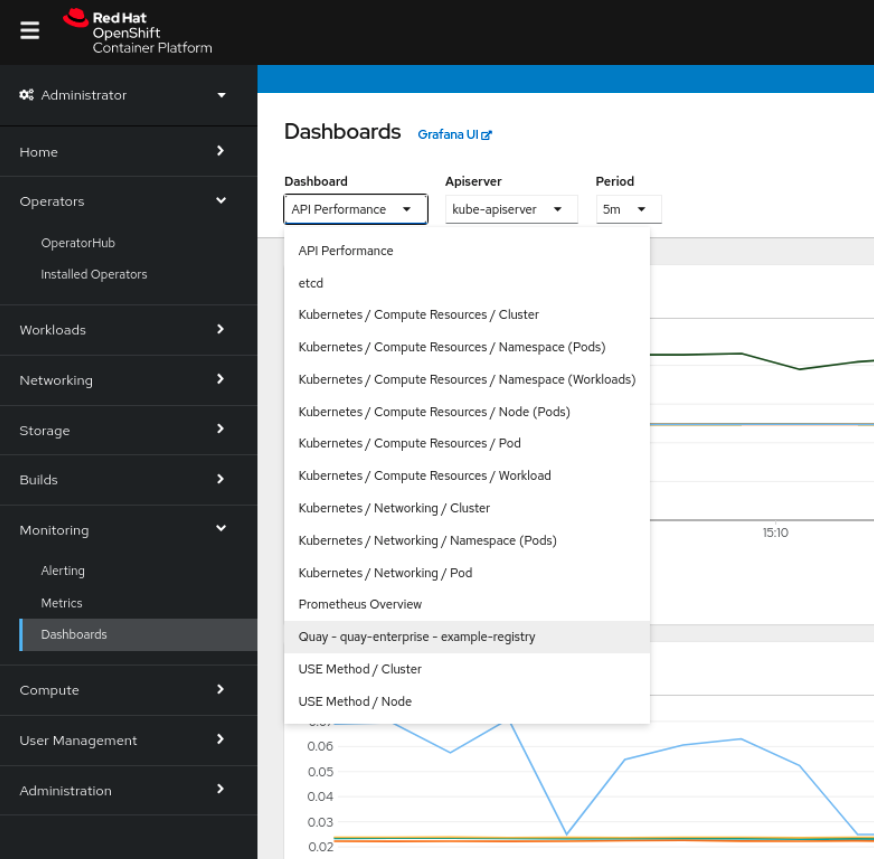
On the OpenShift Container Platform console, click Monitoring → Dashboards and search for the dashboard of your desired Project Quay registry instance:
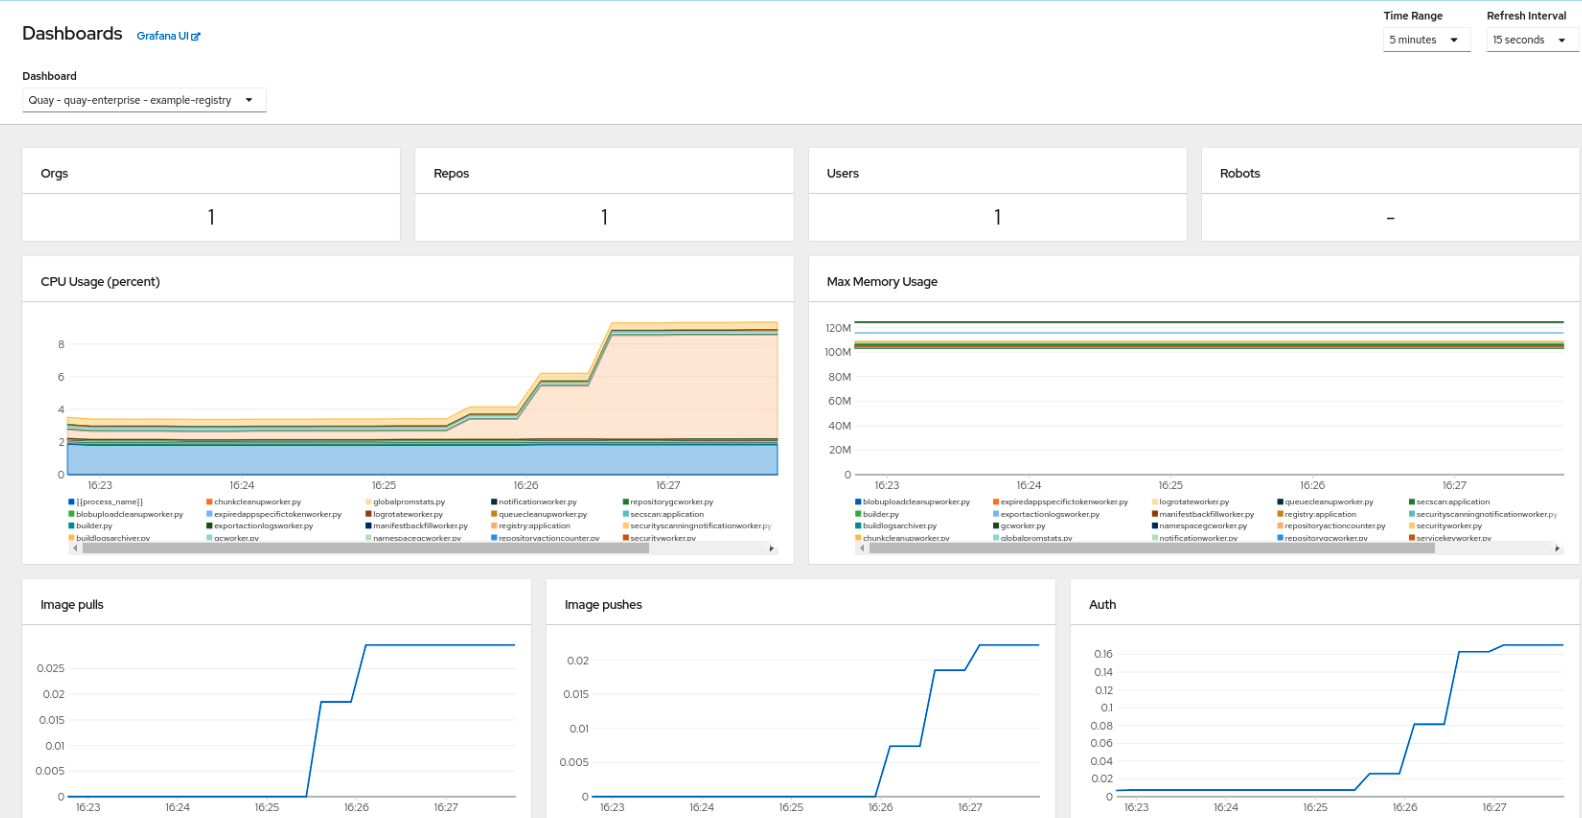
The dashboard shows various statistics including the following:
-
The number of Organizations, Repositories, Users, and Robot accounts
-
CPU Usage
-
Max memory usage
-
Rates of pulls and pushes, and authentication requests
-
API request rate
-
Latencies
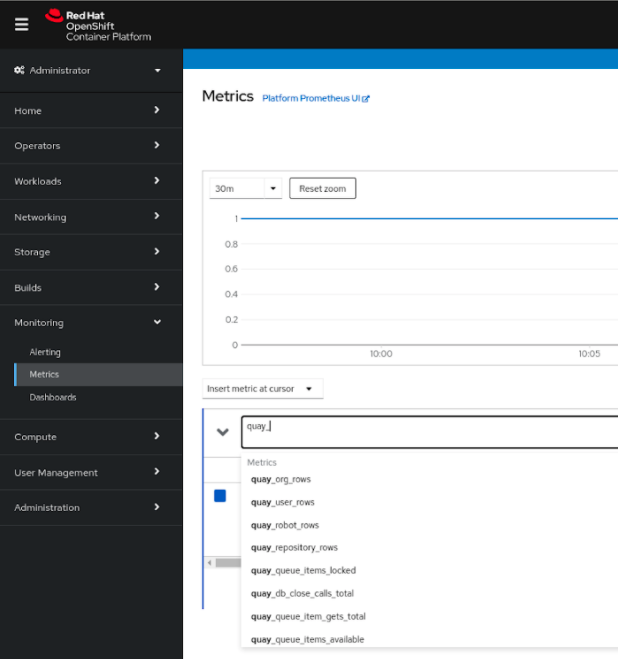
You can see the underlying metrics behind the Project Quay dashboard by accessing Monitoring → Metrics in the UI. In the Expression field, enter the text quay_ to see the list of metrics available:
Select a sample metric, for example, quay_org_rows:
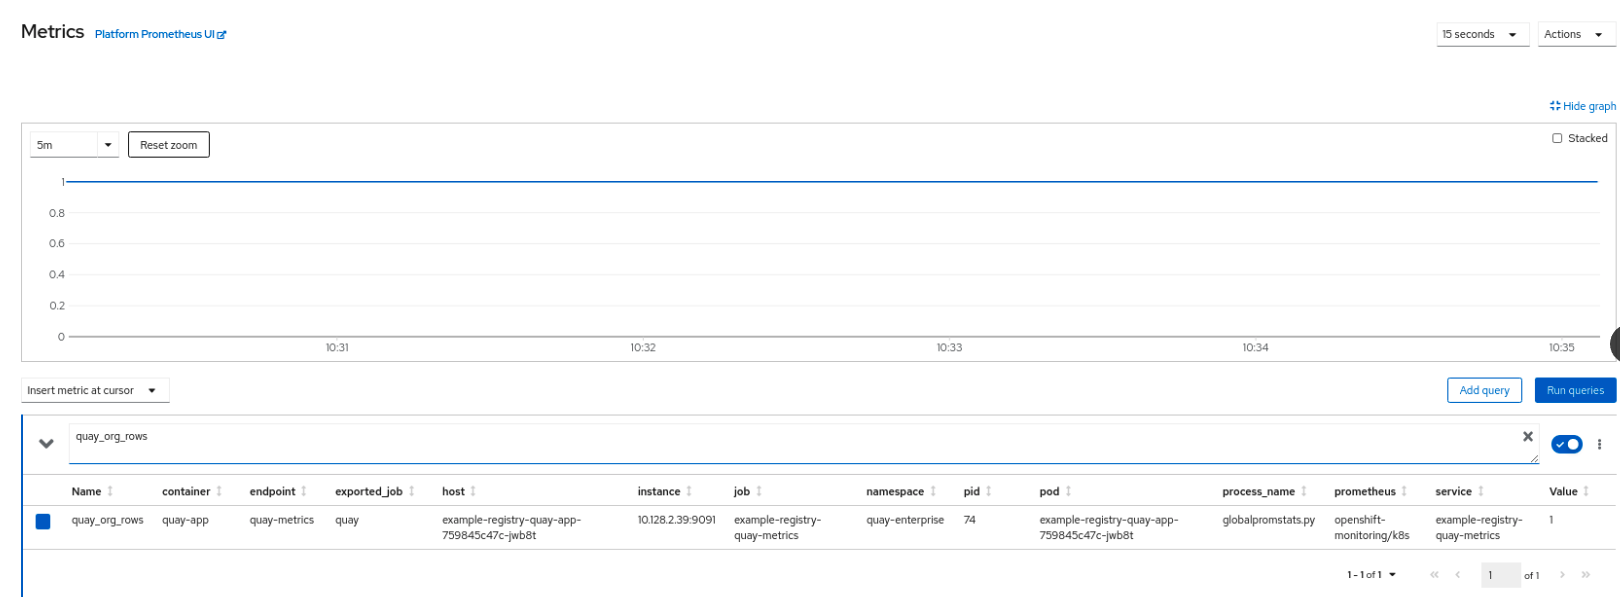
This metric shows the number of organizations in the registry. It is also directly surfaced in the dashboard.
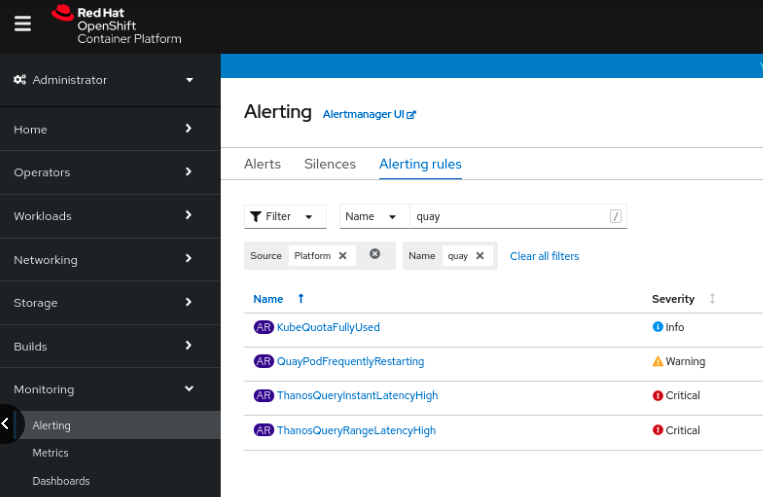
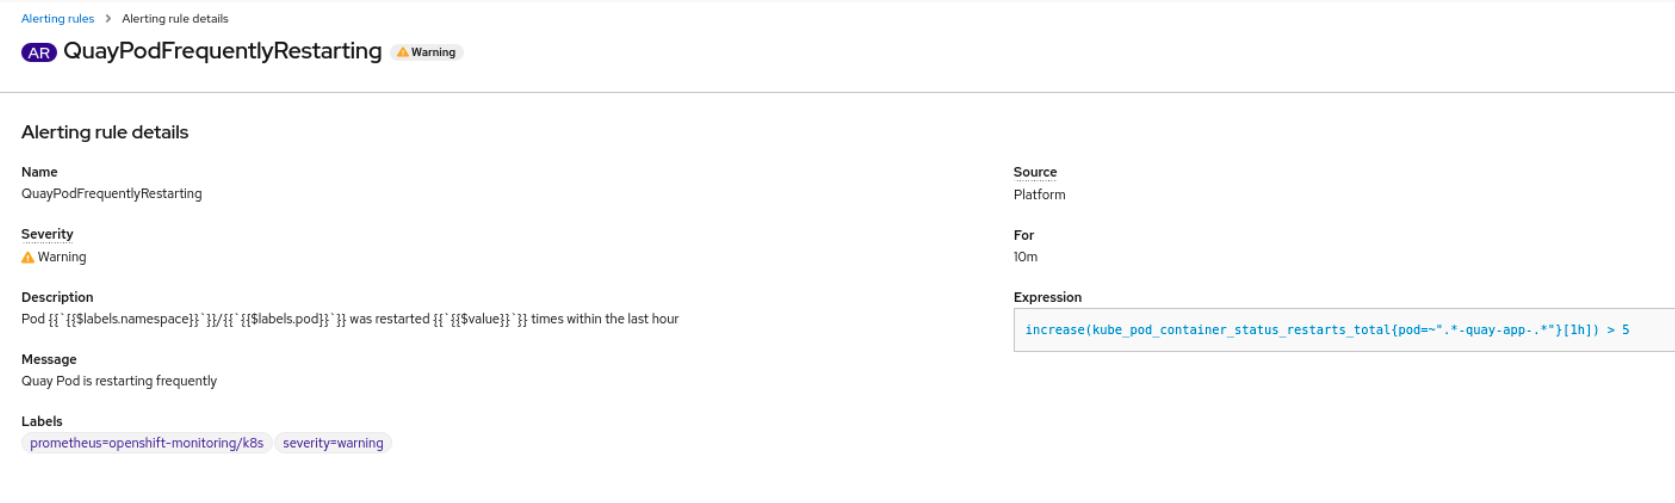
An alert is raised if the Quay pods restart too often. The alert can be configured by accessing the Alerting rules tab from Monitoring → Alerting in the console UI and searching for the Quay-specific alert:
Select the QuayPodFrequentlyRestarting rule detail to configure the alert:
Verify deployment health status
Verify deployment health by using health-check endpoints on Red Hat Quay.
Performing health checks on Project Quay deployments
Use Project Quay health check endpoints to monitor instance, end-to-end, and warning status before issues become critical.
Health checks help ensure that everything is working correctly, and can be used to identify potential issues before they become critical problems. By monitoring the health of a system, Project Quay administrators can address abnormalities or potential failures for things like geo-replication deployments, Operator deployments, standalone Project Quay deployments, object storage issues, and so on. Performing health checks can also help reduce the likelihood of encountering troubleshooting scenarios.
|
Important
|
Links contained herein to any external website(s) are provided for convenience only. Red Hat has not reviewed the links and is not responsible for the content or its availability. The inclusion of any link to an external website does not imply endorsement by Red Hat of the website or its entities, products, or services. You agree that Red Hat is not responsible or liable for any loss or expenses that may result due to your use of (or reliance on) the external site or content. |
Project Quay has several health check endpoints. The following table shows you the health check, a description, an endpoint, and an example output.
| Health check | Description | Endpoint | Example output |
|---|---|---|---|
|
The When |
Default: With Preferred storage unavailable: |
|
|
The By default, only the preferred storage engine is validated. When |
All services healthy: Storage engine unavailable (superuser view with |
|
|
The |
|
|
Note
|
Superusers and sessions with |
To check the health of your Project Quay instance and view service status, you can navigate to the health/instance endpoint in your browser. The endpoint returns JSON with status_code 200 for healthy or 503 when your deployment has an issue.
-
On your web browser, navigate to
https://{quay-ip-endpoint}/health/instance. -
You are taken to the health instance page, which returns information like the following:
{"data":{"services":{"auth":true,"database":true,"disk_space":true,"registry_gunicorn":true,"service_key":true,"web_gunicorn":true}},"status_code":200}For Project Quay,
"status_code": 200means that the instance is healthy. Conversely, if you receive"status_code": 503, your deployment has an issue.
Monitor garbage collection metrics
Review Prometheus garbage collection metrics to confirm registry cleanup workers are running as expected.
Project Quay garbage collection metrics
Use these metrics to track how often Project Quay garbage collection workers run and how many namespaces, repositories, and blobs they remove.
| Metric name | Description |
|---|---|
quay_gc_iterations_total |
Number of iterations by the GCWorker |
quay_gc_namespaces_purged_total |
Number of namespaces purged by the NamespaceGCWorker |
quay_gc_repos_purged_total |
Number of repositories purged by the RepositoryGCWorker or NamespaceGCWorker |
quay_gc_storage_blobs_deleted_total |
Number of storage blobs deleted |
# TYPE quay_gc_iterations_created gauge
quay_gc_iterations_created{host="example-registry-quay-app-6df87f7b66-9tfn6",instance="",job="quay",pid="208",process_name="secscan:application"} 1.6317823190189714e+09
...

# HELP quay_gc_iterations_total number of iterations by the GCWorker
# TYPE quay_gc_iterations_total counter
quay_gc_iterations_total{host="example-registry-quay-app-6df87f7b66-9tfn6",instance="",job="quay",pid="208",process_name="secscan:application"} 0
...

# TYPE quay_gc_namespaces_purged_created gauge
quay_gc_namespaces_purged_created{host="example-registry-quay-app-6df87f7b66-9tfn6",instance="",job="quay",pid="208",process_name="secscan:application"} 1.6317823190189433e+09
...

# HELP quay_gc_namespaces_purged_total number of namespaces purged by the NamespaceGCWorker
# TYPE quay_gc_namespaces_purged_total counter
quay_gc_namespaces_purged_total{host="example-registry-quay-app-6df87f7b66-9tfn6",instance="",job="quay",pid="208",process_name="secscan:application"} 0
....

# TYPE quay_gc_repos_purged_created gauge
quay_gc_repos_purged_created{host="example-registry-quay-app-6df87f7b66-9tfn6",instance="",job="quay",pid="208",process_name="secscan:application"} 1.631782319018925e+09
...

# HELP quay_gc_repos_purged_total number of repositories purged by the RepositoryGCWorker or NamespaceGCWorker
# TYPE quay_gc_repos_purged_total counter
quay_gc_repos_purged_total{host="example-registry-quay-app-6df87f7b66-9tfn6",instance="",job="quay",pid="208",process_name="secscan:application"} 0
...

# TYPE quay_gc_storage_blobs_deleted_created gauge
quay_gc_storage_blobs_deleted_created{host="example-registry-quay-app-6df87f7b66-9tfn6",instance="",job="quay",pid="208",process_name="secscan:application"} 1.6317823190189059e+09
...

# HELP quay_gc_storage_blobs_deleted_total number of storage blobs deleted
# TYPE quay_gc_storage_blobs_deleted_total counter
quay_gc_storage_blobs_deleted_total{host="example-registry-quay-app-6df87f7b66-9tfn6",instance="",job="quay",pid="208",process_name="secscan:application"} 0
...